The province is lifting most remaining health restrictions Tuesday, including capacity limits for indoor public settings. We look at the key indicators.
Life in Ontario is about to change once again, as the province lifts most remaining health restrictions on Tuesday, including vaccine passports and capacity limits for indoor public settings.
But just where do the COVID indicators stand as this happens?
The Star takes stock of the numbers,and surveys the experts for a status report on what this all means.
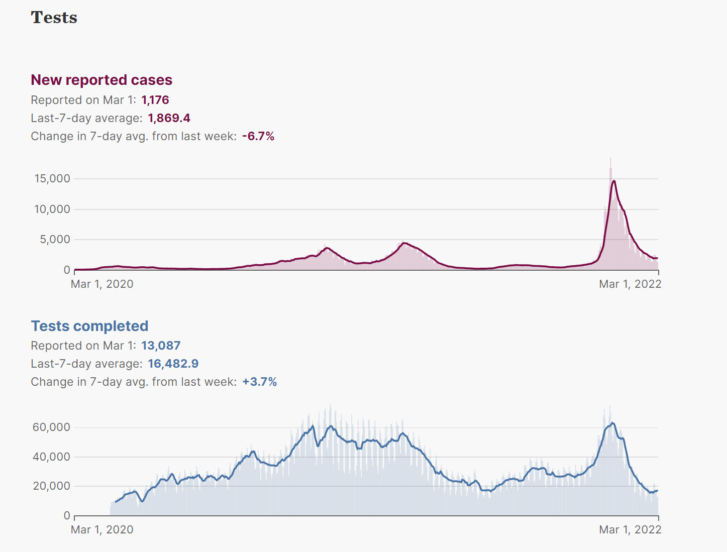
Current restrictions limiting access to polymerase chain reaction (PCR) tests mean that the province’s daily COVID case counts no longer capture all suspected cases. Ontario’s publicly funded testing numbers have plummeted since PCR access was restricted at the end of December, mostly to people at high risk of severe illness, and health workers.
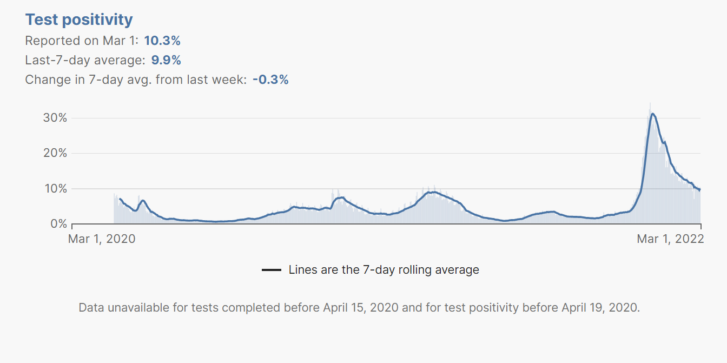
According to the Ministry of Health’s newest data, completed tests have also dropped, as has case positivity, from over 30 per cent in early January to under 10 per cent. The last seven-day average for completed tests stands at around 16,808 per day, a significant drop from the 75,000 PCR tests processed on Dec. 30, the day before testing restrictions were implemented.
Because of limited testing, experts have warned that daily reported cases on their own are no longer a reliable measure of community spread of COVID.
For this reason, Dr. Peter Jüni, scientific director of Ontario’s COVID-19 Science Advisory Table, said the days of mass testing to track COVID are likely over, and that wastewater surveillance is now a key early indicator for community spread, alongside other metrics including hospitalizations and ICU admissions as late indicators.
“We will most likely not go back to mass (PCR) testing because it’s not sustainable from a financial and logistical perspective,” said Jüni. “Rapid testing, I would believe, will continue to be available. This could be important in the future in various situations.”
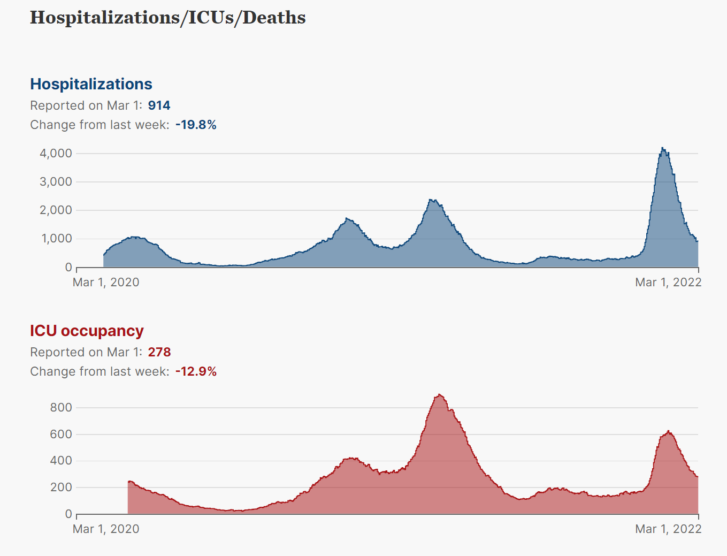
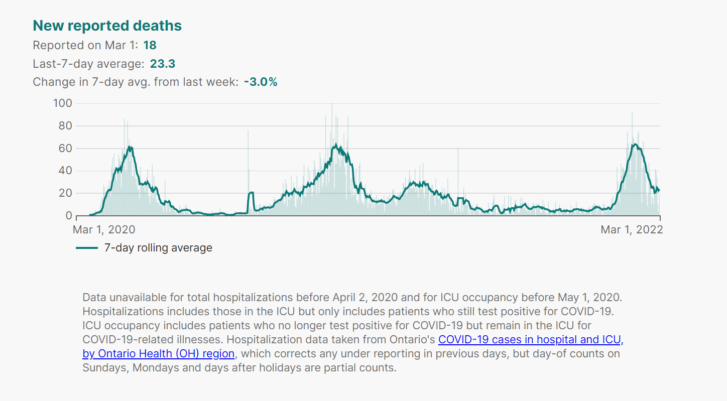
The Ontario Ministry of Health’s latest numbers show that fewer than 300 people are in ICU with COVID, as ICU numbers continue to trend downwards.
Seven new hospitalizations were reported Monday in Ontario, with 849 people currently in hospital testing positive for COVID and 279 people in ICUs. Last Monday, Ontario recorded 1,064 hospitalizations with 320 in ICU.
The latest numbers, from Feb. 27 (announced Feb. 28), report three new deaths, down from 92 in late January. In past waves hospitalizations and deaths show up later, following case numbers.
Jüni said ICU and hospitalization numbers eventually reflect wastewater data, which is an early indicator (10 to 14 days ahead) of community COVID spread.
“Based on wastewater data, we have started to see a flattening of the curve at the beginning of February, and associated with that we are seeing a flattening now and decrease in hospital and ICU occupancy,” Jüni said.
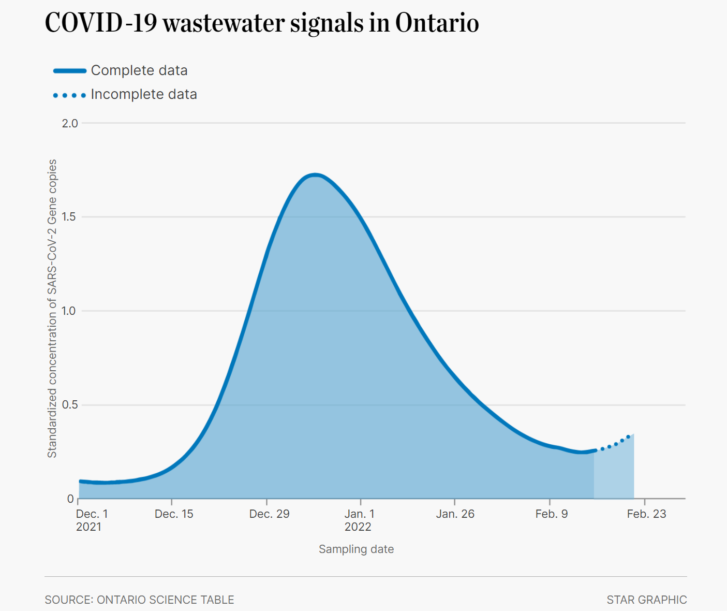
The science table now has a province-wide measure of the wastewater signal on its website, with data pulled from 101 wastewater treatment plants, pumping stations and sewersheds across all 34 health units. The signal was steadily going down, from a peak at around Jan. 5, the highest of the Omicron wave, but it’s now estimated to be trending slightly upwards.
Although that’s with incomplete data, it’s something that worries Tara Moriarty, an associate professor at the University of Toronto in the faculties of dentistry and medicine, and infectious disease researcher.
“It’s the best indicator we have at this point and certainly it’s pretty concerning,” she said.
“You can see that it’s sort of gone down, hit the bottom and it’s just started going back up again.”
This is “not unexpected” with a “pretty solid amount” of the more contagious Omicron subvariant BA.2 in the province, she said. While Moriarty added that vaccine passports are “not the hill to die on” at this point, rolling back mask mandates in this context would be “an incredibly bad idea.”
Jüni said the increase is not a cause for concern because of a combination of vaccination rates and natural immunity from Omicron infection. It’s tough to pinpoint how many people have actually had Omicron though, with PCR tests so scaled back. The science table puts it at between 1.5 million to four million people in Ontario since Dec. 1, according to wastewater data.
“Even if there is a slight uptick it won’t be at the speed we saw in January,” Jüni said, adding that the increase correlates with loosening COVID restrictions in February. “It’s a different ballgame because we built up immunity through the combined efforts of third-dose rollout, vaccination in children and of course through infection.”
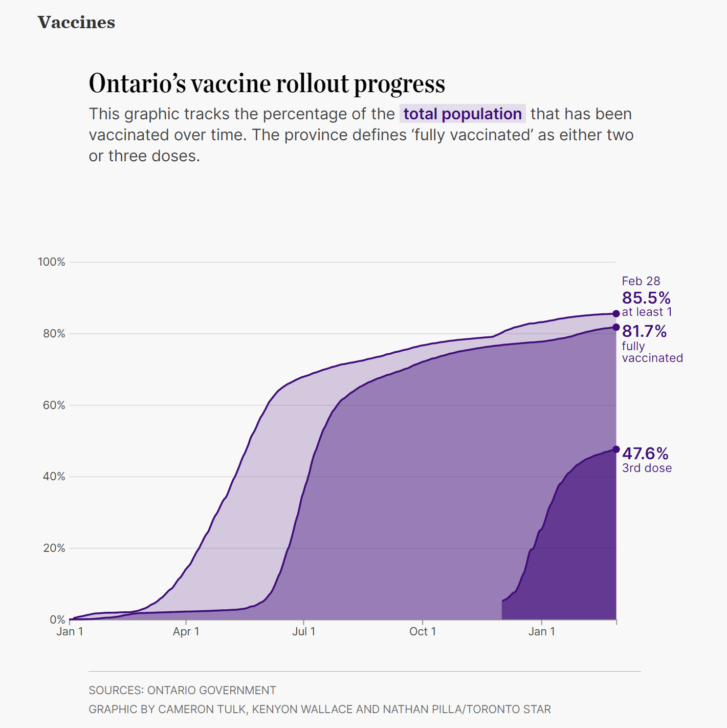
Ontario has a high vaccine rate, with over 85 per cent of the population five and up and about 82 per cent of the total population fully vaccinated.
That’s defined as at least two doses (one for the Johnson & Johnson vaccine).
But, given that Omicron changed the vaccine game, third doses have also become an important metric. About 6.9 million people have received a third dose in the province so far, just under half of the total population.
According to the Science Table only about 58 per cent of people over 18 have third doses.
Moriarty noted that the current risk of COVID infection in Ontario with at least two doses is also starting to creep up again, another indicator tracked by the science table.
This suggests to her that the immunity of people who got third doses back in December/early January may already be starting to wane, and this is not being balanced out by more people getting third doses.
In Toronto, where about 91 per cent of people 12 and up have at least one dose, officials are pivoting away from mass clinics with thousands of people to hyperlocal ones, with outreach from community organizations and local ambassadors, to continue to slowly build third-shot numbers.
“This is literally neighbourhood by neighbourhood, building by building, door by door, text by text, call by call,” said Joe Cressy, a downtown councillor and chair of the city’s board of health.
“This is the last-mile strategy, leave nobody behind.”
An average of just under 6,000 people a day are still getting a dose in the city, he added.
School absentee rates
Since Ontario is not doing comprehensive public PCR testing, it’s very difficult to track cases and outbreaks in schools.
Instead of this data, the province now makes available the percentage of staff and students who are absent.
According to the province there are currently two schools closed due to COVID, out of 4,844 across Ontario. When a school has an absentee rate of 30 per cent it must notify public health to discuss next steps.
In the Toronto District School Board, for example, on Monday one school had an over 60 per cent absence rate, four schools had 50 per cent or higher, one school had over 40 per cent, and five had 30 per cent or higher.
But, as spokesperson Ryan Bird, notes, “it’s important to note that these numbers do not necessarily reflect absences due to COVID, but reflect a whole host of reasons.”
U of T’s Moriarty calls this “a really interesting indicator” but without further analysis, such as plotting absenteeism against wastewater data, it’s hard to know if absences are due to COVID or other unrelated factors.
Article From: The Star
Authors: Ghada Alsharif, May Warren

